

Why finance teams still don’t trust their numbers
An ERP, a BI platform and a polished dashboard can all work as designed. But Finance might still hesitate before using the result.
The margin dashboard is ready for the management meeting. Then someone asks: “Why doesn’t this match the number we used last month?”
The team opens the ERP, exports transactions to Excel and starts reconciling. Perhaps the dashboard is wrong. Perhaps both figures are correct, but one includes freight and the other does not. Until someone can explain the difference, neither number feels safe to use.
This is not an unusual tension. In a 2024 BlackLine survey, 37% of CFO respondents said they did not completely trust the accuracy of their organisation’s financial data. That is a finding from one vendor-sponsored survey, not a measure of every finance team. Still, it captures a familiar problem: having a number available is different from knowing what it represents and how it was produced.

A correct calculation can answer the wrong question
Imagine a report showing gross margin by product. Sales and cost of goods sold reconcile perfectly to the ledger. Yet the commercial manager expects a different margin because freight is treated separately in their view. The production manager is looking at standard cost, while Finance has included a month-end variance adjustment.
There may be no broken formula. The disagreement is about definition, timing and purpose. Which margin should guide pricing? Which should explain operational performance? Which should reconcile to the financial statements? Calling all three “margin” invites avoidable confusion.
Research on information systems has long distinguished system quality from information quality. DeLone and McLean’s information-systems success model treats them as separate dimensions. A fast, reliable reporting platform therefore does not by itself settle whether its output is relevant, understandable and useful to the person making a decision.
Trust can break before the dashboard
A report is the last visible step in a longer chain:
Business question → financial definition → operating process → ERP setup and transactions → data model → report → decision
A product can carry the wrong cost group. A purchase can be posted to an unexpected account. A process can be followed differently across sites. Historical mappings can survive after the business has changed. A BI model can then aggregate each transaction faithfully and still produce a result that surprises its users.
This is why a discrepancy should be traced back through the chain. If a variance appears in Power BI, changing the visual or measure may be appropriate—but only after understanding whether the issue started in the calculation, the source data, the accounting treatment or the shared definition.
A review of research by Rikhardsson and Yigitbasioglu examines the relationship between business intelligence and management accounting. Its relevance here is that analytics is part of the management-accounting process, not merely a presentation layer added at the end. How finance defines and uses information matters alongside the technology that delivers it.
Excel is often where the doubt becomes visible
When a controller exports a report, adds a mapping table and manually adjusts a figure, the spreadsheet may be doing work the reporting chain has not yet made explicit. The adjustment might encode a valid business rule. It might also hide an error or create another version of the truth.
The useful question is not “How do we stop people using Excel?” It is “What are they checking or changing, and why?” Repeated manual reconciliations can reveal missing definitions, weak master-data ownership or a gap between statutory and management reporting. Once the logic is understood, the team can decide which checks belong in the system, which adjustments need governance and which genuinely require professional judgement.
What rebuilding trust looks like?
Start with one important number people regularly challenge—product margin, procurement spend or production cost, for example. Agree on its purpose and definition, including inclusions, exclusions and timing. Trace a few surprising transactions from report back to source. Make ownership clear for master data, accounting rules and report logic. Then document the reconciliation between related views and expose material exceptions instead of quietly smoothing them away.
The aim is not to make every figure identical. Management, operational and statutory views may legitimately differ. Trust grows when those differences are intentional, explainable and reproducible.
A finance team should be able to answer three questions without starting a new investigation every month: What does this number mean? Where did it come from? What explains the difference from the other number?
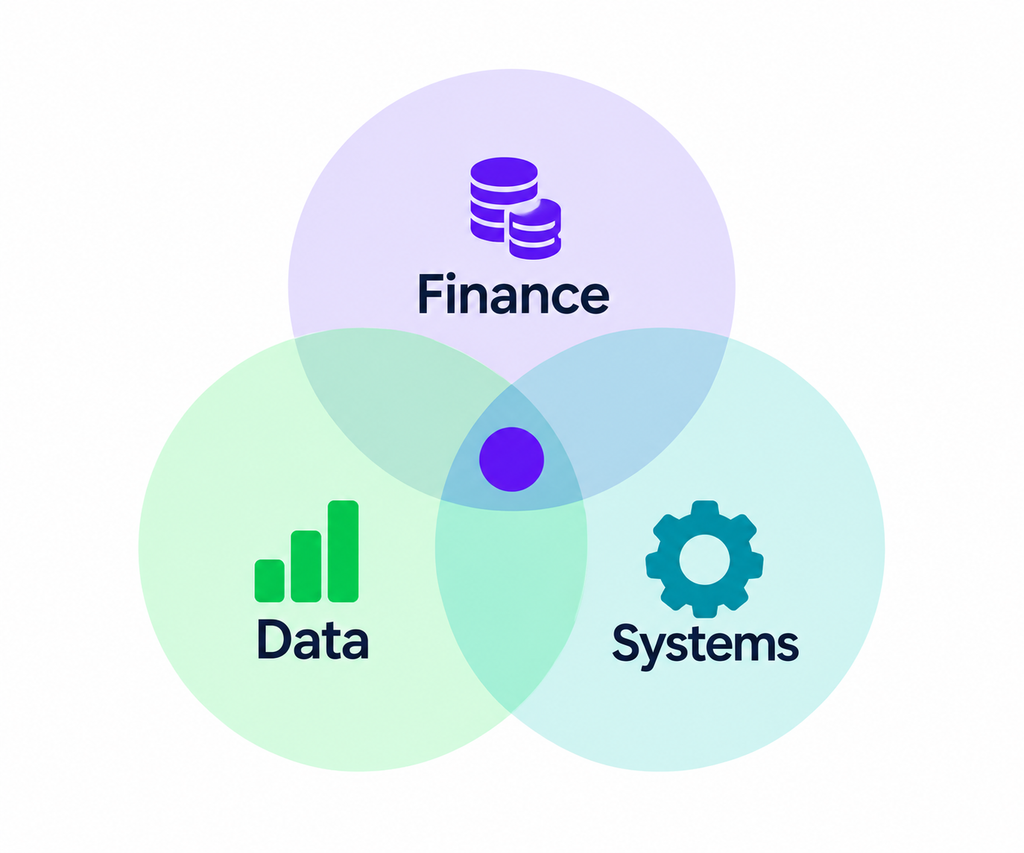
That is where finance, data and systems connect—and where reporting becomes something people can act on.
Finance. Data. Systems. Connected.
Further reading
- BlackLine, 2024 survey on trust in financial data. Vendor-sponsored survey; the 37% figure refers to CFO respondents, not all finance professionals.
- DeLone, W. H. & McLean, E. R. (2003), The DeLone and McLean Model of Information Systems Success: A Ten-Year Update, Journal of Management Information Systems.
- Rikhardsson, P. & Yigitbasioglu, O. (2018), Business intelligence & analytics in management accounting research: Status and future focus, International Journal of Accounting Information Systems.